Wired to Be Poor
Revised Second Edition · 60 figures · 200+ sources
The psychology of financial self-sabotage, rebuilt with deeper research and harder numbers.

Wired to Be Poor
Most financial advice misses the real problem. The problem is wiring.
The Second Edition is a rebuild, not a reprint. 473 pages. 12 chapters plus a new essay on modern travel and a full appendix of global rental yields and business survival rates. 60 figures drawn from the data. 200+ sources. 61 in-line citation boxes that show the source and the reasoning, not just a footnote at the back.
Intelligent people sabotage their own finances every day. Not because they lack information. Because their identity, their instincts, and their internal set-point were calibrated for an environment that no longer exists. This book maps that wiring and gives you the framework to change it.
Edition
Second · 2026
Formats
Paperback · Hardcover · Kindle
Length
473 pages · 60 figures
A Rebuild, Not a Reprint.
The first edition shipped in 2015. Eleven years later, the thesis still holds, but the evidence is sharper, the data is heavier, and there are arguments the original draft never made. Here is what is different.
A standalone chapter on lifestyle consumption the rest of the book points at but never names. The math, the cognitive story, the health cost, and what is sold to families. Backed by Maddux-Galinsky, Bhattacharjee-Mogilner, the Bankrate 2024 survey, and the Harvard Study of Adult Development.
Every major claim gets a sourced box. Citation, paraphrase, and the reason the source is in the book. No back-of-the-book pretending. The Citation Index lists every source and every page it appears on.
From the Hankins-Hoekstra-Skiba bankruptcy curve to Damodaran's S&P real-return chart, the asset/liability split, global rental yields, and the 8-week vacation happiness fade. A Figure Index in the front matter lets you jump straight to any chart.
Top 25 and bottom 15 global rental yield markets from Numbeo 2025–2026. Ten-year business survival rates by industry from BLS Business Employment Dynamics data. The numbers most personal-finance books either dodge or invent.
Two full voice passes. Hyperbole stripped. Number formatting standardized. Author-quote count capped at four per author, so Buffett and Munger stop running the book. First person throughout. No em-dashes anywhere.
Two new disclaimer pages up front. Legal scope and an honest accounting of how the book was researched and assembled. Production transparency is a Second-Edition standard, not a footnote.
Named Researchers. Real Numbers. Cited In-Line.
The Second Edition is built on specific studies, not generic "experts say." A sample of who shows up in the book and why.
The Stanford delayed-gratification study from the late 1960s. The children who waited went on to measurably better life outcomes. Paired in the book with Kidd, Palmeri & Aslin (Rochester, 2013), which showed wait times tripled when the experimenter had first kept a promise. Self-control as environmental calibration, not personality.
35,000 Florida lottery winners matched against bankruptcy court records. Bankruptcy risk is elevated in years three to five after the win. The famous "70% go broke in seven years" line is a fabrication. This study replaces it with real data, and the timing maps onto the financial thermostat the chapter builds.
Daryl Bem, 1972. When internal identity cues are weak, people infer their own identity from observing their own behavior. This is the clinical mechanism behind the book's motion-before-identity sequence. Cited alongside William James (1899) on why action and feeling are coupled.
JPSP, 2009. Living abroad with active cultural adaptation predicts measurable creativity gains. Tourism does not. They ran the tourist condition and it came back null. The travel industry borrows the immersion finding to sell a product the finding does not support.
Journal of Consumer Research, 2014. Eight studies. Younger adults get more happiness from extraordinary peaks. Past the late twenties, ordinary daily experiences match or beat them. By 35 with a job and a family, the hedonic arithmetic has flipped. The Bali trip is mispriced for its target customer.
Journal of Political Economy, 1991. Ten years of seniority on the same job raises the typical American male worker's wage by over 25 percent. Paired with Dahl & Sorenson (Management Science, 2012) on the Danish entrepreneur population, where founders who stayed in their home region outperformed those who relocated, even when the home region was economically worse.
The 36 percent of $200K-plus earners living paycheck to paycheck. The rate barely moves between the $200K bracket and the $500K-plus bracket. Income does not solve the wealth problem. Paired in-text with the 2025 Goldman Sachs report on $500K-plus earners.
Templeton on the four most dangerous words in investing. Thaler in Misbehaving on why the wiring is not a personal failing but the cost of running a primate brain inside a modern market. The synthesis chapter draws the laws from people who watched cycles for fifty years apiece.
Following the same families since 1938. Satisfaction with close relationships at age fifty predicted physical health at eighty better than cholesterol. Holt-Lunstad's 2010 meta-analysis on 308,000 people put weak social ties on par with smoking 15 cigarettes a day. The cheapest experiences win on the longest horizon.
A sample. The full Citation Index in the book lists every source. Other names that appear in-line include Kahneman, Housel, Ramsey, Ravikant, Feynman, Damodaran, Bessembinder, Cialdini, Laibson, Woodburn, Pareto, Samuelson & Zeckhauser, Arkes & Blumer, Quoidbach, Nawijn, de Bloom, Oishi & Schimmack, Holmes & Rahe, Algan-Hémet-Laitin, and Steffen.
What the Data Actually Looks Like.
Six representative figures from the book's 60. Every major claim is paired with a chart. The full set is spread across the 12 chapters, the travel essay, and the appendices.
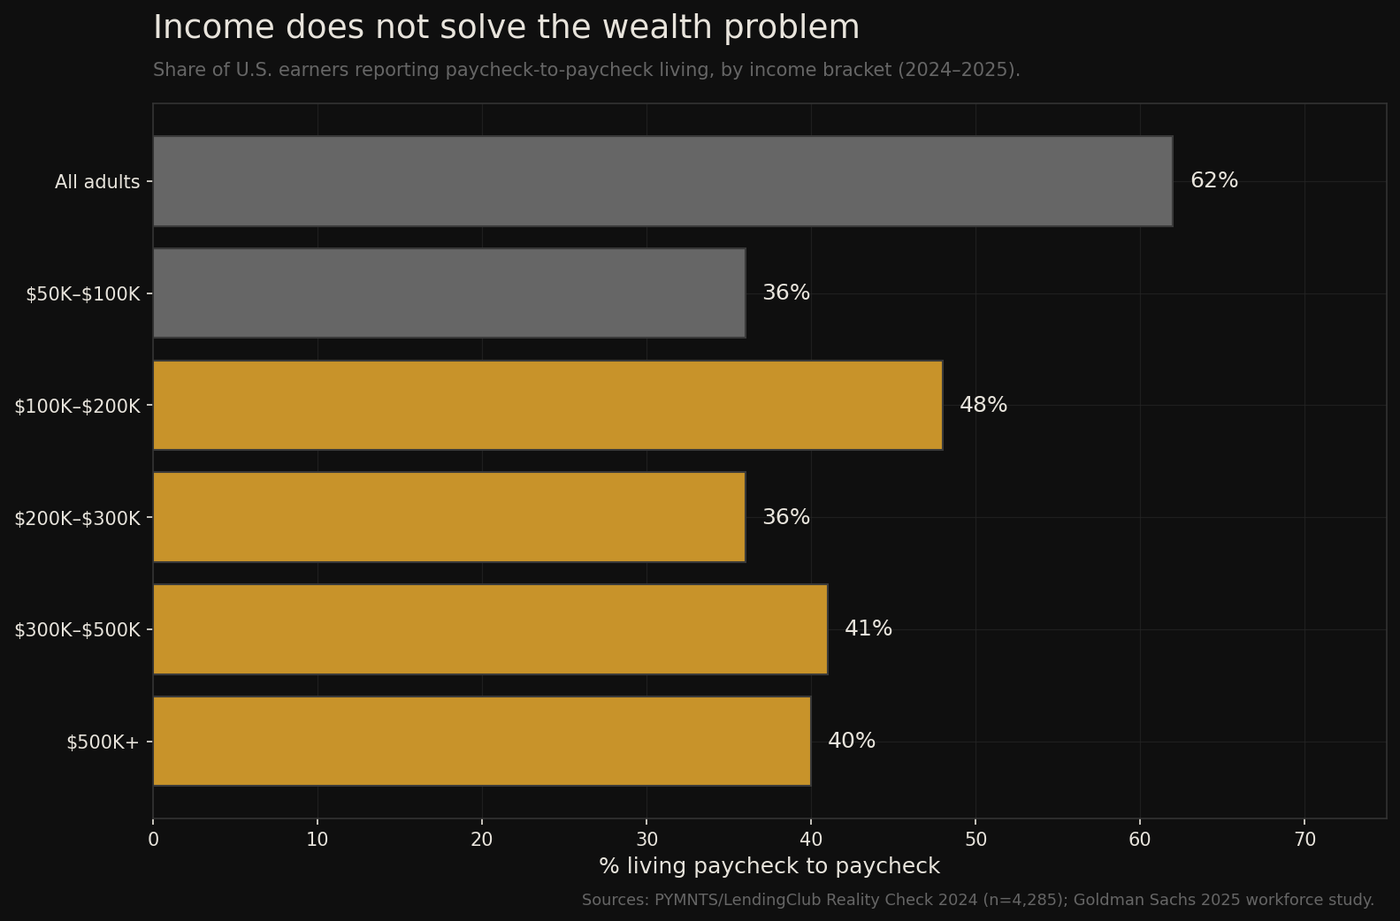
Share of U.S. earners living paycheck to paycheck by income bracket. The rate barely moves between the $200K and $500K-plus brackets. PYMNTS/LendingClub 2024, paired with the Goldman Sachs 2025 workforce study.
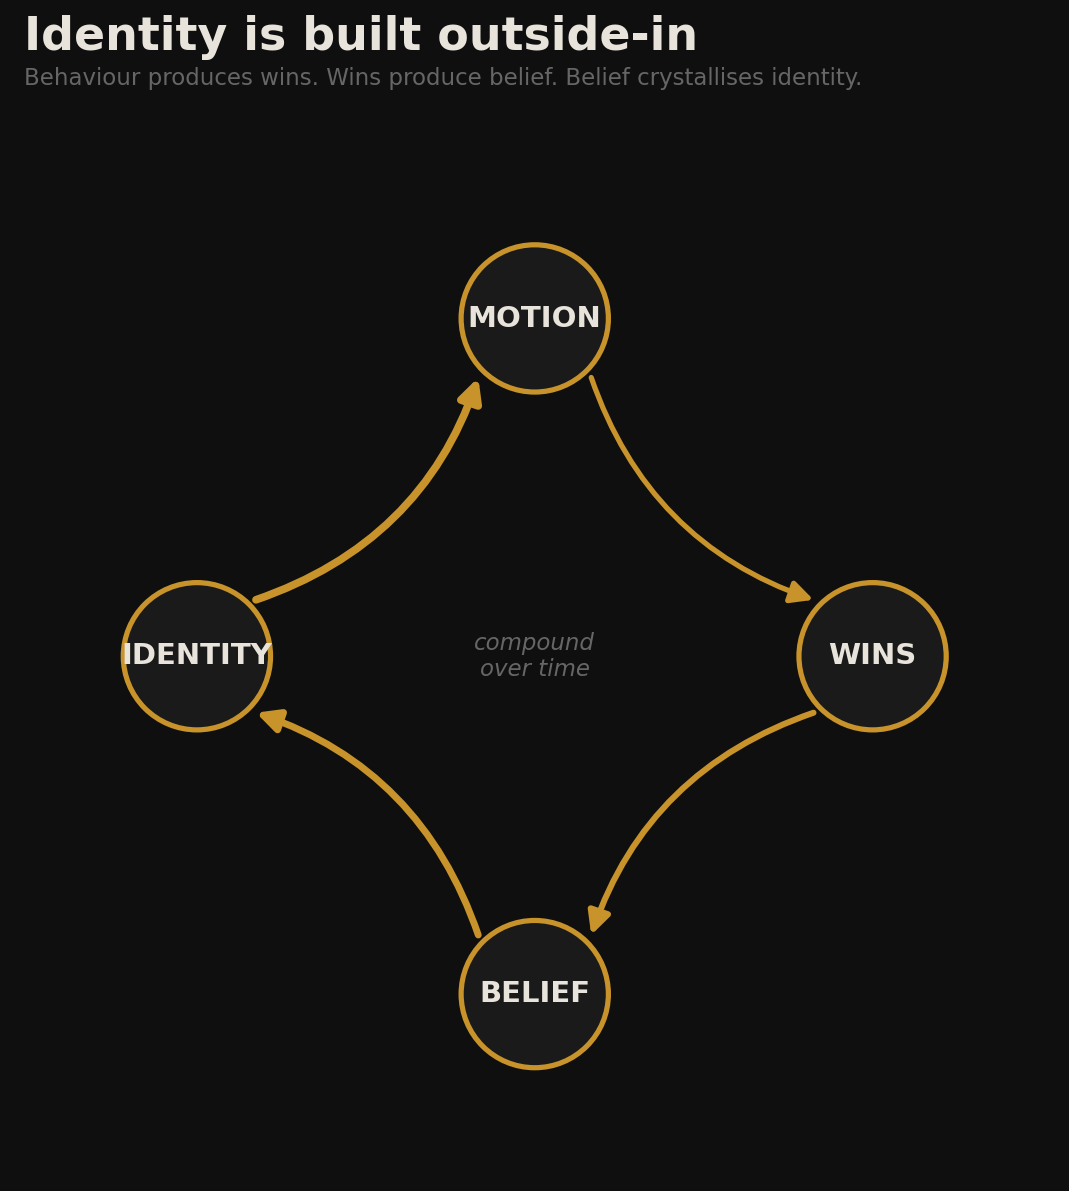
The motion-wins-belief-identity loop drawn from Bem (1972) and James (1899). Declaration does not change identity. Behavior produces wins, wins produce belief, belief crystallises into identity. The sequence runs the opposite direction from what most self-help books teach.
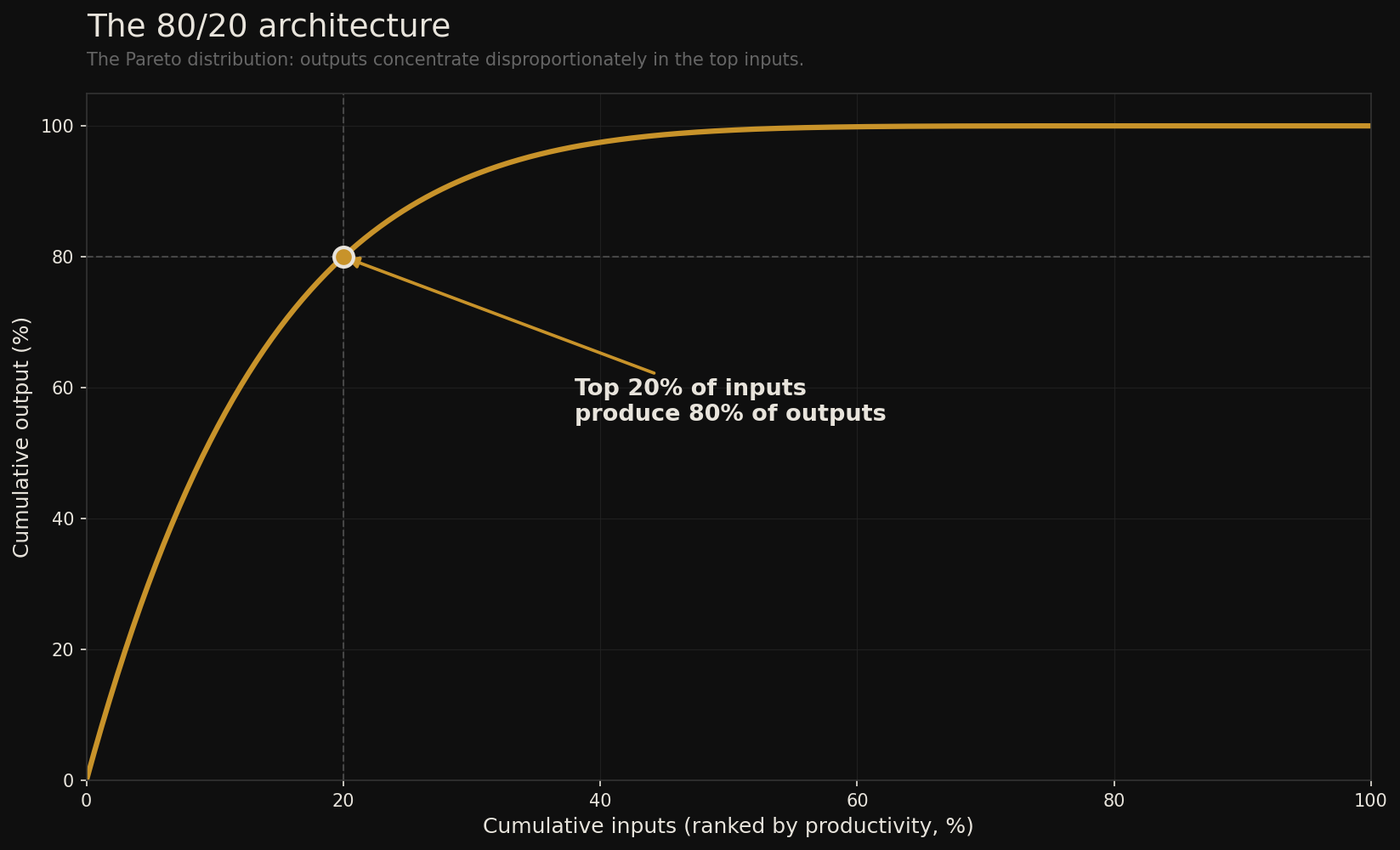
Outputs concentrate disproportionately in the top inputs. The same curve maps onto clients, projects, hours, and capital. The chapter uses it as a cutting tool: if 80% of revenue comes from 20% of clients, the other 80% of clients are not paying for themselves.
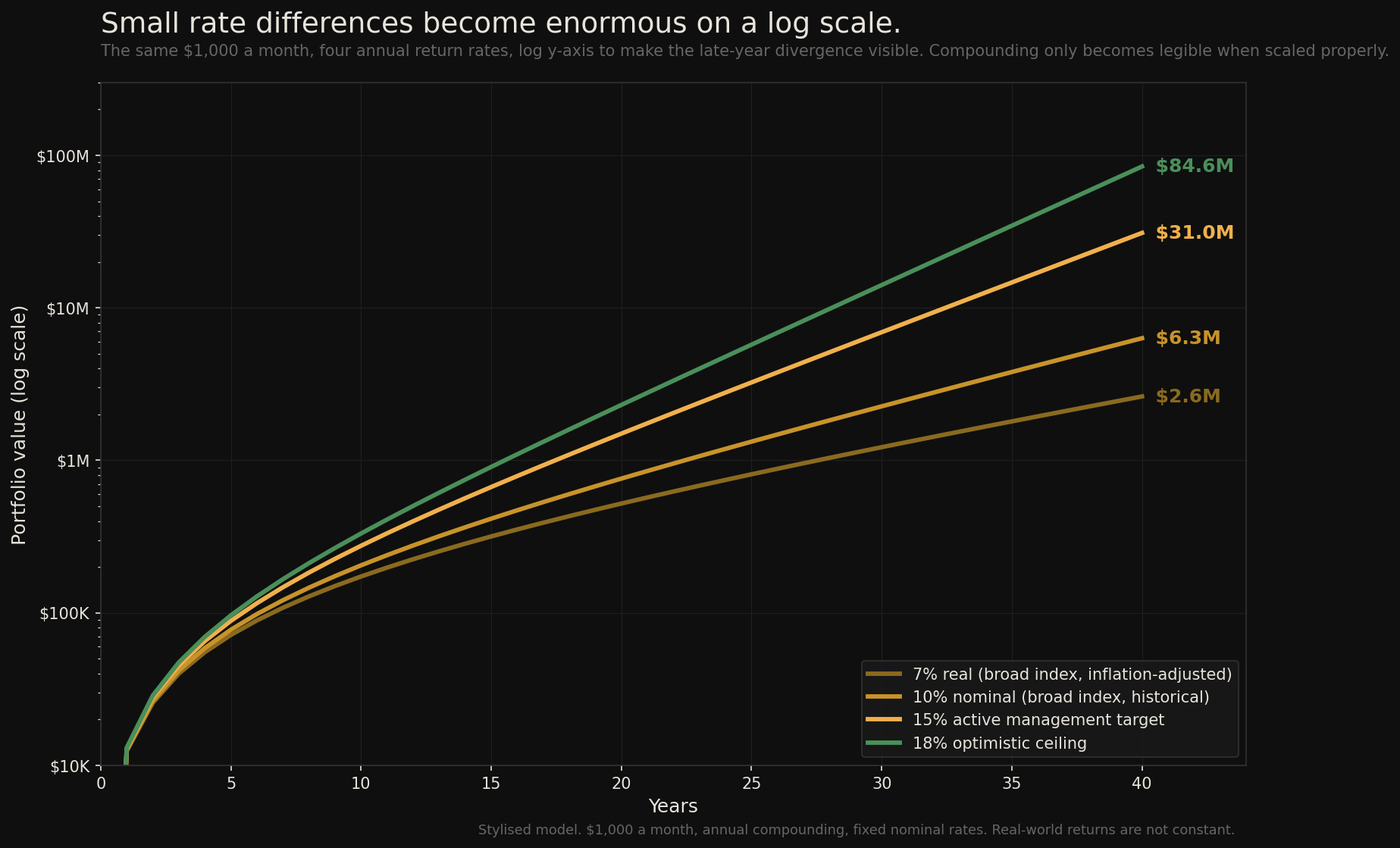
$1,000 a month, four annual return rates, log y-axis to make the late-year divergence visible. 7% real ends at $2.6M. 18% optimistic ends at $84.5M. The chart is the answer to "why does the rate of return matter so much."
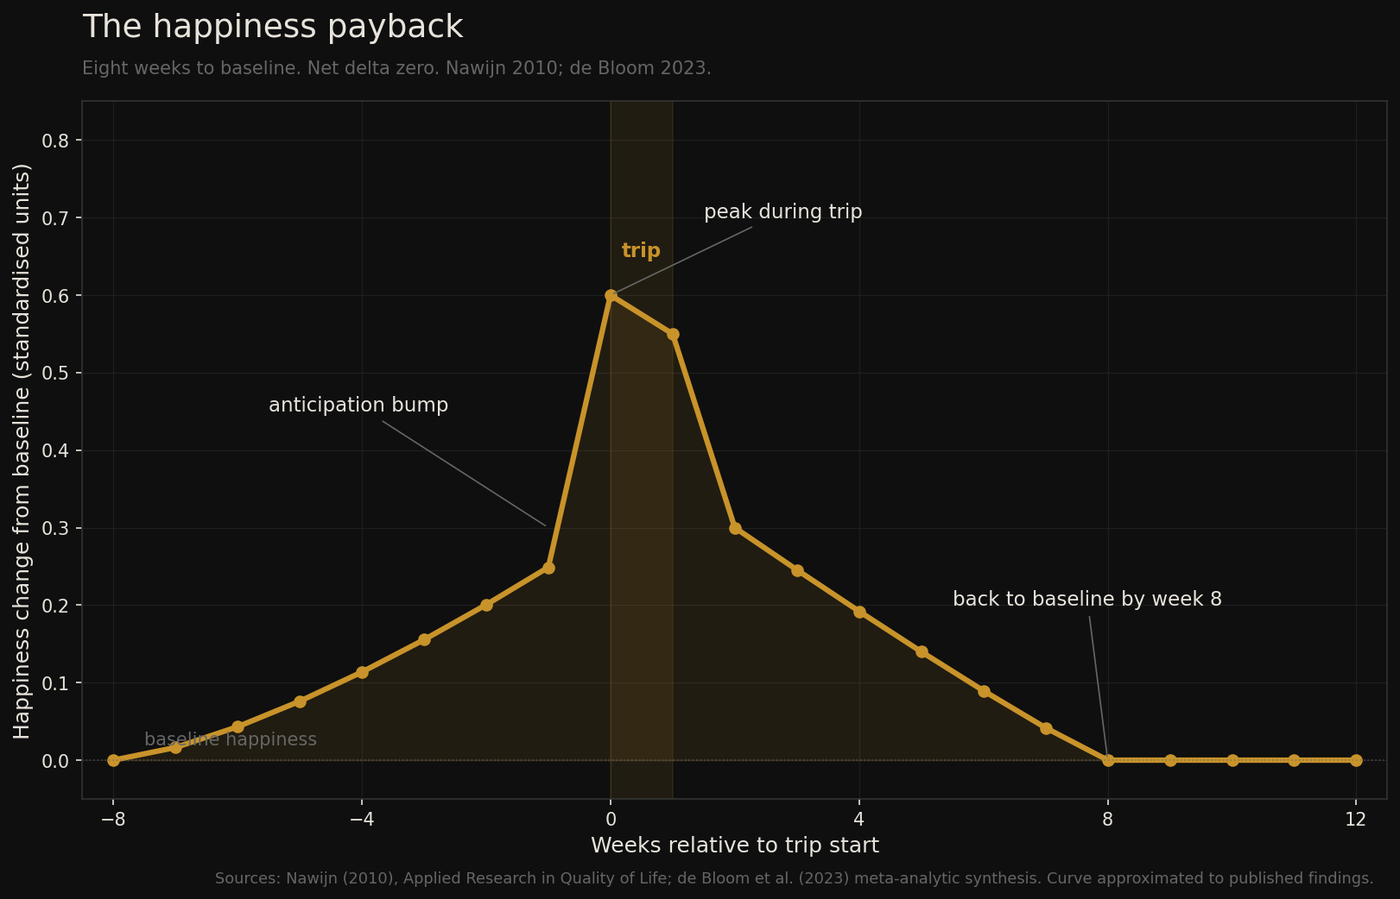
Happiness change relative to trip start. Anticipation bump, peak during the trip, then linear decay back to baseline by week eight. Net delta zero. Drawn from Nawijn (2010) and the de Bloom (2023) meta-analytic synthesis.
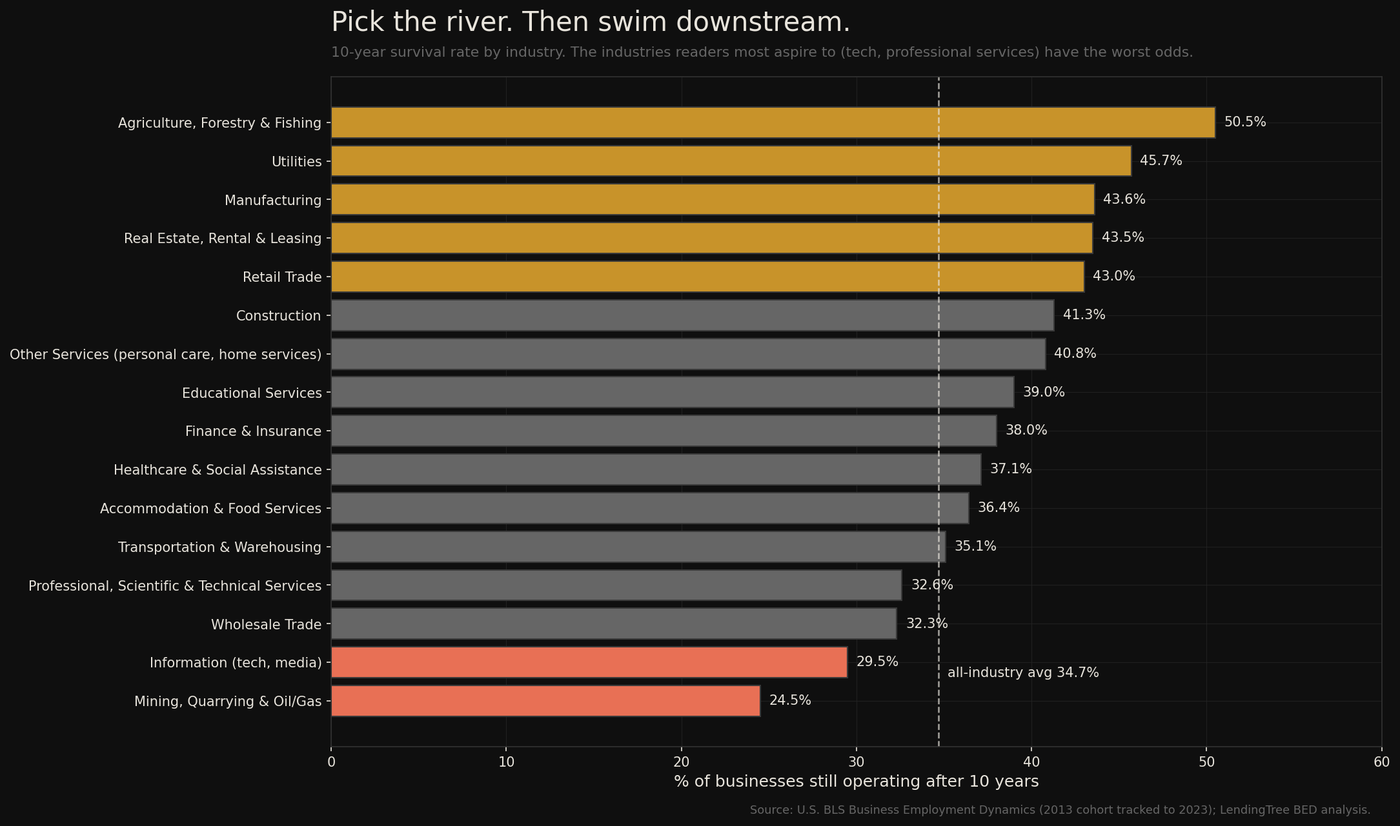
10-year business survival rate by industry. The industries readers most aspire to (tech, media, professional services) have the worst odds. Agriculture, utilities, and manufacturing have the best. BLS Business Employment Dynamics, 2013 cohort tracked to 2023.
You Are Not Broke. You Are Wired That Way.
200,000 years of hunter-gatherer pressure tuned a brain to consume immediately, hoard nothing, and treat any future beyond next week as fiction. 300 years of capitalism have not rewritten that wiring. The brain that helped your ancestors survive is the brain making your financial decisions now.
You can know every rule of the game and still play it from an identity installed before you ever heard the rules. Declaration does not change identity. Motion does. Behavior creates wins. Wins create belief. Belief hardens into identity. The sequence runs outside-in, not the other way around.
The market does not pay for hours. It does not pay for excellence in the abstract. It pays for the gap your work closes for someone who desperately needs it closed. Wealth comes from buying assets that work without you, not from trading more time for a higher hourly rate.
Twelve Chapters, One Essay, Two Appendices.
Identity, biology, and resistance. Why "declare it and the behavior follows" is backwards for the people who need this book most. The thermostat that pulls every lottery winner back to broke. The motion-emotion-identity loop drawn from Bem and James.
Value as the only game. The 80/20 law applied to time, clients, and capital. The money machine. Assets that work without you. Business as the fastest scalable income. Net present value, discounted properly. Exit. The math that compounds while you sleep.
The synthesis chapter on the laws that govern wealth across every cycle. The standalone essay on modern travel and the lifestyle consumption pattern the rest of the book points at. The appendices on global rental yields and ten-year business survival rates. The conclusion.
The Book in Numbers
ISBN 9798197787231. Independently published, 2026. EB Garamond interior. Live on Amazon.
Buy on AmazonISBN 9798197797100. Larger trim, tighter typography, the same Second Edition interior.
Buy on AmazonReflowable text with full schema.org accessibility metadata, popup footnotes, alt text on every figure, and both NCX and EPUB 3 navigation.
Buy on AmazonMore Books
The same money science as this book, rebuilt for ages 10 to 17. Twelve chapters, journal aesthetic, real research.
Read about Your Money Brain23 strategy lessons for operators who sense the rules are changing around them.
Read about The Expiry DateStrategy and systems thinking taught through a full-colour illustrated comic.
Read about The Expiry Date: Kids